Verifying the working and performance of the RabbitMQ integration in Studio Server can be done by using the RabbitMQ Events Monitor of Studio Server.
The Events Monitor is run from a Web browser and subscribes to all queues that the user has access to. It listens for events coming in to those queues and displays every event on the page.
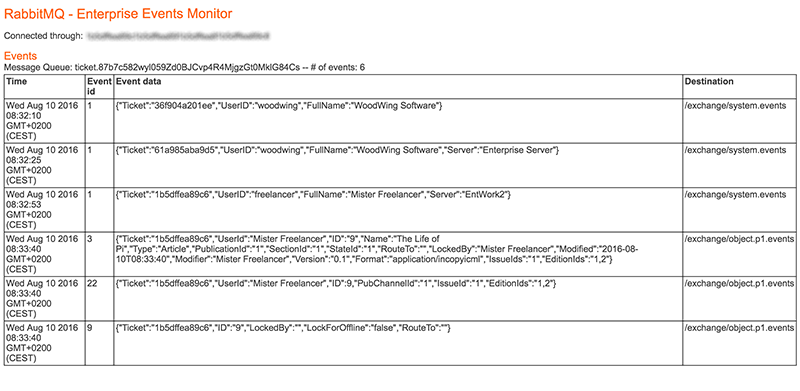
Figure: The Studio Server Events Monitor for RabbitMQ.
Note: For the purpose of this article it is assumed here that a RabbitMQ integration is in place and fully working.
Running the Events Monitor
Step 1. In your Web browser, access the following URL:
<Studio Server URL>/StudioServer/wwtest/rabbitmq/ent_events_monitor.php?user=<username>&pass=<password>
|
Example: http://localhost:8080/StudioServer/server/wwtest/rabbitmq/ent_events_monitor.php?user=woodwing&pass=ww |
You are automatically logged in to Studio Server and the RabbitMQ integration.
Note: When running the Events Monitor over HTTPS / SSL, see Running the Events Monitor over HTTPS / SSL for the first time.
The Events Monitor will subscribe to the queues of all Brands that you have access to and will start listening for messages in all these queues.
Step 2. Verify that the Events Monitor runs correctly, for example by logging in to Studio Server using Studio and logging out again. These events should appear in the system.events queue.
Step 3. Perform an action within a Brand, such as creating a Dossier. Events should appear for the relevant queue.
Troubleshooting
When the Events Monitor is not working correctly, this is indicated by one of the following:
- No text is shown after "Connected through:"
- When no data is shown below the "Events" header (information about your message queue, the number of events and a table with all received events — see above screenshot).
In some cases the Events Monitor will alert you with an error message while in other cases it might not.
Note: When no alert is shown on screen, verify the console for an error message.
Possible errors and their possible solutions are:
| Scenario | Cause |
|---|---|
| Error: Unable to connect to Studio Server |
Possible causes:
|
| Logged in but no queues are showing | The Events Monitor only shows queues that the user has access to. Ensure that your user is part of a group that is authorized to the Brand you are working in. |
| No events appear in my queue |
Possible causes:
|
Running the Events Monitor over HTTPS / SSL for the first time
The Events Monitor connects with Studio Server and subsequently with RabbitMQ. Both connections can be over HTTPS / SSL.
When using a self-signed certificate that is not trusted by the Web browser, messages are shown through which the connection for Studio Server can be trusted, while a more manual process needs to be followed to have the Web browser trust the connection for RabbitMQ.
Note: The following steps show the process for Firefox but can be used for all Web browsers.
Step 1. Run the Events Monitor.
A warning is shown that the connection is not secure.
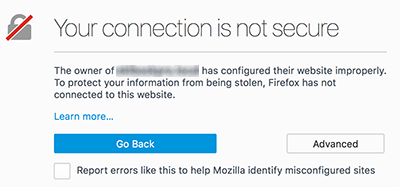
Step 2. Click Advanced to expand the window.
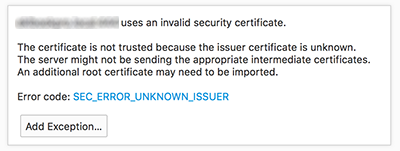
Step 3. click Add Exception... .
A window appears asking you to confirm the connection.
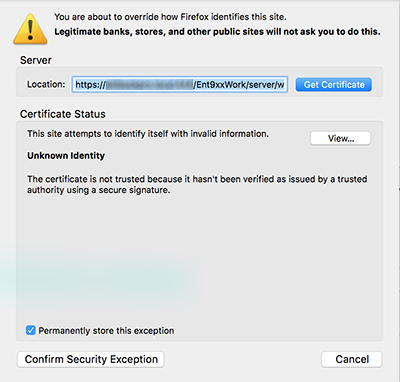
Step 4. Click Confirm Security Exception.
The connection with Studio Server is now trusted and the Events Monitor continues loading.
When trying to connect to RabbitMQ, the connection fails and a 'Lost connection' error is shown.
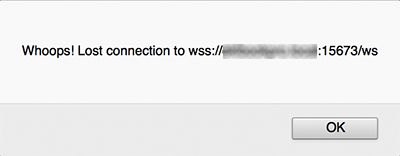
Step 5. Copy the URL from the window and click OK.
Step 6. Paste the URL in the address bar of your Web browser, replace the 'wss' prefix by 'https' and press Enter.
Step 7. The same messages appear as for trusting the Studio Server connection in steps 1 to 4 above. Follow these up to clicking Confirm Security Exception.
The page continues loading but remains empty, which is OK.
Step 8. Enter the URL of the Events Monitor in the address bar again and press Enter.
The Events Monitor now loads properly.
Comments
0 comments
Please sign in to leave a comment.